
The average Richmond upon Thames home reached £818,949 in June, up 2.7% in a month. The year-long fall has narrowed to 0.3%, but flats are still down 1.6%.
The average home in Richmond upon Thames sold for £818,949 in June, according to figures published on 19 August by HM Land Registry. That is £21,695 more than the month before, a rise of 2.7%.
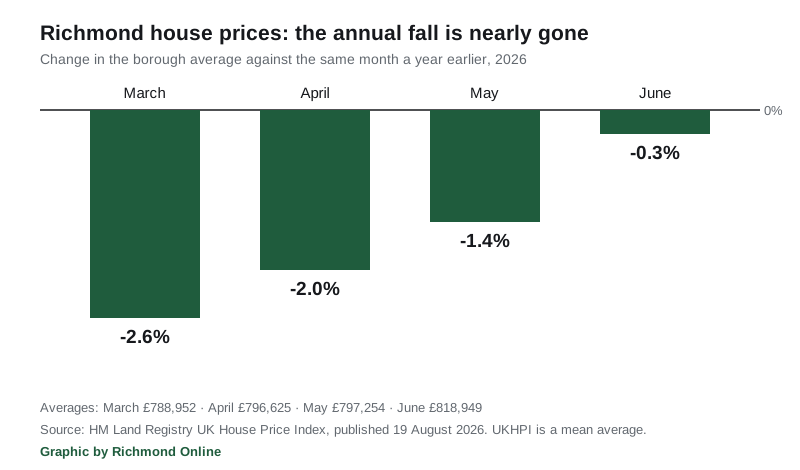
It also means the borough’s year-long price fall has almost run out. In March the average Richmond home was worth 2.6% less than a year earlier. In June it was 0.3% less, a gap of £2,517 on a house worth well over three quarters of a million pounds.
The figures come from the UK House Price Index, which is built from completed Land Registry sales rather than asking prices. One thing to hold on to before reading any of it: UKHPI is a mean average, not a median. A handful of very large sales in a borough like this one pull it upwards.
The fall has narrowed every month since March
The annual change in the borough, month by month, on the current version of the index:
- March 2026: average £788,952, down 2.6% on a year earlier
- April 2026: average £796,625, down 2.0%
- May 2026: average £797,254, down 1.4%
- June 2026: average £818,949, down 0.3%
The May figure has been revised upwards
There is a catch worth knowing about, because it changes a number this site published earlier in the summer.
When the May data first came out, it put the Richmond average at £788,872, a fall of 2.5% on the year. That is the figure reported at the time, including on our own Richmond house prices page. It has since been revised to £797,254, a fall of 1.4%.
That is £8,382 higher than the first published number. The index gets revised every month as late sale registrations come in, and early figures for a single borough move more than most people assume. The June figure will move too.
Flats are the exception
The borough-wide number hides four very different markets. Over the year to June:
| Property type | Average price, June 2026 | Annual change |
|---|---|---|
| Detached | £1,818,630 | +0.1% |
| Semi-detached | £1,206,674 | +0.4% |
| Terraced | £932,320 | +0.6% |
| Flat or maisonette | £500,329 | -1.6% |
Houses of every kind are now worth slightly more than they were a year ago. Flats are not, and they are the only segment still falling. A Richmond flat is the cheapest way into the borough at just over half a million pounds, and it is also the only type whose value went backwards over the last twelve months.
The first-time buyer average across all property types was £651,131 in June, down 0.3% on the year. Buyers using a mortgage paid an average of £824,681. Cash buyers paid £802,752.
Richmond against its neighbours
The borough is doing better than most of its immediate neighbours, and better than London as a whole:
| Area | Average price, June 2026 | Annual change |
|---|---|---|
| Kingston upon Thames | £594,498 | +2.9% |
| Hounslow | £512,888 | +1.1% |
| Richmond upon Thames | £818,949 | -0.3% |
| Wandsworth | £680,105 | -5.2% |
| Hammersmith and Fulham | £725,562 | -13.3% |
| London | £553,870 | -2.5% |
| England | £293,262 | +1.8% |
Two things stand out. Richmond remains far more expensive than every borough it borders, by £224,451 over Kingston and £306,061 over Hounslow. And the sharp falls in London this year have landed east of here: Hammersmith and Fulham is down 13.3% on the year, Wandsworth down 5.2%.
What it means for you
If you are selling. The direction of travel has changed, but the borough average is still slightly below where it was in June 2025. A house is a better position to be selling from than a flat. Do not price off the borough average either way: it is a mean across everything from a Ham flat to a Petersham house, and the by-type figures above are far closer to a useful guide.
If you are buying. The window in which Richmond prices were visibly falling has closed for houses. It has not closed for flats. The first-time buyer average of £651,131 is what the entry point actually looks like here, against £553,870 for the London average across all buyers.
If you are checking your council tax band. These are sale prices, not council tax valuations, which are still based on what a property was worth on 1 April 1991. A rising average does not move your band.
If you want the underlying detail. Ward-level medians, the number of sales behind the figures and the longer run of data are on our Richmond house prices page, and every recorded sale is searchable on the Land Registry’s own service.
The next UK House Price Index, covering July 2026, is due at 9.30am on 16 September 2026.
Frequently asked questions
What is the average house price in Richmond upon Thames?
£818,949 in June 2026, the most recent month in the UK House Price Index. That is 2.7% up on May and 0.3% down on June 2025. It is a mean average across every property type, so it sits well above what a typical flat or terraced house sells for.
Are house prices in Richmond going up or down?
Both, depending on what you are buying. Over the year to June 2026 detached, semi detached and terraced houses all rose slightly, by 0.1%, 0.4% and 0.6%. Flats and maisonettes fell 1.6%. The borough-wide figure was 0.3% down.
How much do first-time buyers pay in Richmond?
An average of £651,131 in June 2026, down 0.3% on the year. The equivalent average across all buyers in London was £553,870.
Why did the May figure change?
The UK House Price Index is provisional and revised every month as late sale registrations are added. May was first published at £788,872 and now stands at £797,254, £8,382 higher. Single-borough figures move more on revision than national ones.
When is the next release?
9.30am on 16 September 2026, covering July.
Sources
- UK House Price Index, Richmond upon Thames, June 2026, HM Land Registry, for every Richmond figure, the by-type averages, the first-time buyer average and the monthly series.
- UK House Price Index reports, HM Land Registry, for the 19 August 2026 publication date and the 16 September 2026 release of the July data.
- UK House Price Index data for London, Kingston upon Thames, Hounslow, Wandsworth and Hammersmith and Fulham for the comparison table.
UK House Price Index figures are provisional and revised each month. Contains HM Land Registry data © Crown copyright and database right 2026, and public sector information licensed under the Open Government Licence v3.0.
Have your say