
The average Richmond home sold for £803,249 in July, down £9,349 in a month. Flats are now worth less than in January 2023, while detached houses rose 2.4%.
The average home in Richmond upon Thames sold for £803,249 in July 2026, according to the Land Registry’s UK House Price Index, published on 18 September. That is £9,349 less than in June, a fall of 1.2% in a single month and the steepest one-month drop since July last year.
Over the year the borough has barely moved. Prices are down £6,385, or 0.8%, on July 2025.
The split underneath that flat number is the story. Houses of every kind are worth more than a year ago. Flats are worth 3.1% less, and a Richmond flat is now worth slightly less than it was in January 2023.
One number first, because it changes how you read the rest: the UKHPI average is a mean, not a median. A handful of sales on Richmond Hill or in Petersham pulls it upward in a way a midpoint would not.
What each kind of home is worth
| Property type | July 2026 | Change in a year | Index (Jan 2023 = 100) |
|---|---|---|---|
| Detached | £1,814,548 | +£43,316 (+2.4%) | 104.5 |
| Semi-detached | £1,192,249 | +£14,763 (+1.3%) | 105.4 |
| Terraced | £915,886 | +£1,871 (+0.2%) | 106.4 |
| Flat or maisonette | £487,215 | -£15,745 (-3.1%) | 98.3 |
| All property | £803,249 | -£6,385 (-0.8%) | 102.8 |
The index column is the part worth sitting with. It measures each type against January 2023. Terraced houses are 6.4% above that point, semis 5.4% and detached 4.5%. Flats are at 98.3, which means the typical Richmond flat has lost value over three and a half years while every house around it has gained.
That matters locally more than it would in most boroughs, because flats are what people buy first here. The Land Registry puts the average first-time buyer price in Richmond at £636,085 in July, down from £645,903 a year earlier.
Richmond is holding while the other expensive boroughs fall
Richmond is the fourth most expensive borough in London to buy in, behind Kensington and Chelsea, Westminster and Camden. The other three have had a far worse year.
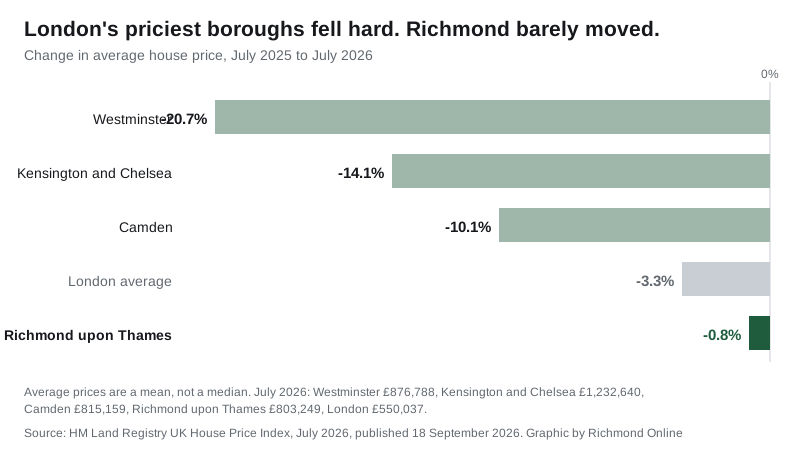
- Westminster £876,788, down 20.7% in a year
- Kensington and Chelsea £1,232,640, down 14.1%
- Camden £815,159, down 10.1%
- Richmond upon Thames £803,249, down 0.8%
For comparison, the London average is £550,037, down 3.3%, and the England average is £293,479, up 1.1%.
Next door the picture is mixed. Wandsworth is at £686,076 and down 5.5% on the year. Kingston upon Thames is at £591,555 and up 3.3%. Hounslow is at £525,435 and up 1.7%.
So Richmond sits in an odd position: expensive enough to be grouped with prime central London, but behaving far more like the outer south-west London boroughs around it.
Far fewer people are moving
The number of sales has dropped much further than prices have.
Land Registry sales volumes lag by a few months, so June and July are not yet published. What is published shows the borough recording 129 sales in April 2026 and 138 in May, against 243 in July 2025 and 279 in August 2025.
| Month | Sales |
|---|---|
| August 2025 | 279 |
| October 2025 | 259 |
| December 2025 | 178 |
| February 2026 | 144 |
| April 2026 | 129 |
| May 2026 | 138 |
Some of that is the ordinary winter dip. The scale of it is not: April’s 129 sales are fewer than half of August’s 279. A thin market also makes the monthly average price jumpier, which is part of why June rose 1.4% and July fell 1.2%.
A correction to what we reported in August
When we covered the June index we gave the borough average as £818,949. The Land Registry has since revised that month down to £812,598, a reduction of £6,351.
That is normal. UKHPI figures are revised as more completed sales are registered, and early months move the most. It is worth knowing if you are tracking the number month to month: the first print of any month is an estimate that will change.
What it means for you
If you are selling a flat. You are in the one part of this market that has gone backwards. A flat bought in the borough in early 2023 is, on these figures, worth marginally less now. Price against recent completed sales rather than against what similar flats were asking last year.
If you are selling a house. Detached and semi-detached prices are up on the year, but the number of buyers is down sharply. Expect the sale to take longer than the price suggests it should.
If you are buying your first home. The average first-time buyer price in the borough has fallen by nearly £10,000 in a year, to £636,085. That is still roughly £86,000 above the borough-wide flat average, which tells you most first-time purchases here are not the cheapest flats on the market.
If you are checking your council tax band. Council tax bands are still based on values on 1 April 1991 and do not move with these figures. Our Richmond council tax bands page sets out what each band costs this year.
There is a separate question hanging over the top of this market: the government’s proposed surcharge on homes worth more than £2 million, and reports that the threshold could drop to £1.5 million. Richmond Council published its own estimate of how many local homes would be caught on 22 September, and we have set that out in our report on the mansion tax threshold.
Longer-term figures, including ward-level medians from the Land Registry’s Price Paid data, are on our Richmond house prices page.
Frequently asked questions
What is the average house price in Richmond upon Thames?
£803,249 in July 2026, on the Land Registry’s UK House Price Index. That is down £9,349 on June and down £6,385, or 0.8%, on July 2025. The figure is a mean average across all property types, not a median.
Are Richmond house prices going up or down?
Down slightly. The borough is 0.8% cheaper than a year ago. The direction differs sharply by property type: detached houses are up 2.4% on the year, semi-detached up 1.3% and terraced up 0.2%, while flats are down 3.1%.
How much does a flat cost in Richmond?
£487,215 on average in July 2026, down £15,745 in a year. On the Land Registry’s index a Richmond flat is worth about 1.7% less than in January 2023, which makes it the only property type in the borough that has lost value since then.
How does Richmond compare with the rest of London?
It is the fourth most expensive borough, at £803,249 against a London average of £550,037. The three dearer boroughs have all fallen much further over the year: Westminster is down 20.7%, Kensington and Chelsea down 14.1% and Camden down 10.1%, against Richmond’s 0.8%.
How much do first-time buyers pay in Richmond?
£636,085 on average in July 2026, down from £645,903 a year earlier.
Sources
- UK House Price Index, Richmond upon Thames, July 2026, HM Land Registry, for every average price, index value and sales volume for the borough quoted above.
- UK House Price Index for July 2026, HM Land Registry, published 18 September 2026, for the release date and the national and London figures.
- UK House Price Index data for Westminster, Kensington and Chelsea, Camden, Wandsworth, Kingston upon Thames and Hounslow, July 2025 and July 2026, from the same Land Registry dataset, for the borough comparison. All annual changes quoted are the index’s own published annual change figures.
Have your say